Note
Go to the end to download the full example code.
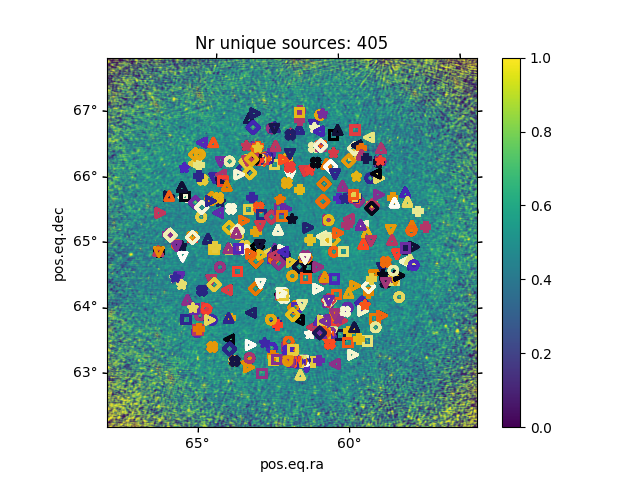
Plot all sources
In this example we take a TraP export database and plot all extracted sources on a background map.
The extracted sources will be colored based on their src_id, meaning that exracted sources that
have been linked to each other by the association will get the same color and symbol.
Let’s start by opening the test database.
import astropy

import matplotlib.pyplot as plt
import numpy as np
import pandas as pd
import sqlalchemy
from astropy.io import fits
from astropy.wcs import WCS

import trap
from trap.source_extraction import read_pyse_image

db_path = "../tests/data/lofar1/GRB201006A_60_images.db"
db_handle = trap.io.open_db("sqlite", db_path)

image_cmap = "viridis"
scatter_cmap = "CMRmap"
rng = np.random.default_rng(111111)
markers = ["o", "s", "D", "^", "v", "P", "*", "X", "<", ">"]


def plot_sources():
    with db_handle.connect() as db_conn:
        image_query = sqlalchemy.text("""
            SELECT url FROM images WHERE id=(SELECT max(id) FROM images);
            """)
        source_query = sqlalchemy.text("""
            SELECT ra,dec,src_id FROM extracted_sources;
            """)
        sources = pd.read_sql_query(source_query, db_conn)

    image_path = "../tests/data/lofar1/GRB201006A_final_2min_srcs-t0000-image-pb.fits"
    im = fits.open(image_path)[0]
    wmap = WCS(im.header, naxis=2)
    ax = plt.subplot(projection=wmap)
    data = im.data[0, 0]

    pyse_im, im_meta, rejected = read_pyse_image(image_path)

    ax.imshow(
        data,
        vmin=np.nanpercentile(data, 2),
        vmax=np.nanpercentile(data, 98),
        cmap=image_cmap,
    )

    total_nr_sources = sources["src_id"].max()
    for i in range(0, int(total_nr_sources)):
        sources_slice = sources[sources["src_id"] == i]
        colormap = getattr(plt.cm, scatter_cmap)
        color = colormap(rng.random())
        marker = rng.choice(markers)
        im = ax.scatter(
            sources_slice.ra,
            sources_slice.dec,
            marker=marker,
            facecolors="none",
            edgecolors=color,
            linewidth=2,
            transform=ax.get_transform("fk5"),
        )
    ax.set_title(f"Nr unique sources: {total_nr_sources}")
    ax.coords[0].set_format_unit(astropy.units.deg)
    ax.coords[1].set_format_unit(astropy.units.deg)
    plt.colorbar(im)
    return ax


ax = plot_sources()
plt.show()
End time not specified in ../tests/data/lofar1/GRB201006A_final_2min_srcs-t0000-image-pb.fits, setting to start
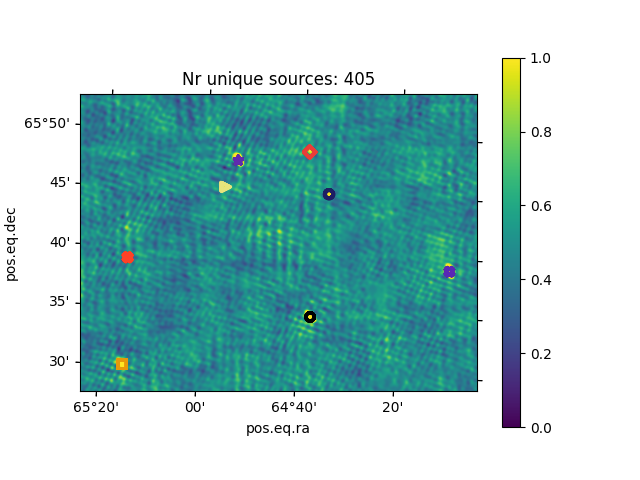
Zooming in a bit will show the distribution in the location for a given source.
ax = plot_sources()
ax.set_xlim(1000, 1400)
ax.set_ylim(2300, 2600)
plt.show()
End time not specified in ../tests/data/lofar1/GRB201006A_final_2min_srcs-t0000-image-pb.fits, setting to start
Total running time of the script: (0 minutes 9.595 seconds)